-
STEM spot: Planner

This planner helps you draw up a STEM project. This step-by-step plan focuses on the different phases of the learning process. More information can be found on the stemspot.be website.
Translated by
 ImageOrganisation, company, NPO
 -
Circular Economy: Infographic

This infographic is the principle diagram of the circular economy: the butterfly diagram.
It shows the different possibilities for circularity for biological (left half) and technical (right half) materials, in order of value retention for those …
Translated by
Image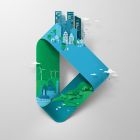
-
Form of government of a country

An infographic about the different forms of government:
- democracy or dictatorship,
- monarchy, republic or theocracy.
Translated by
Image (22)Teacher -
Beverage and food: Water footprint price lists

These price lists show you how much water it costs to make certain drinks and meals. Nice to use to raise awareness about the water footprint at school parties, receptions ...
Translated by
Image (5)
-
Water Footprint: Infographics

In a few images we provide information about the water footprint in general, the water footprint of clothing, paper, food, snacks and drinks and some tips to reduce your water footprint.
Translated by
Image (20)
-
Blank grid

A simple squared grid that can be used in worktops.
Translated by
Image (19)Teacher -
Perspective and views according to the American method

With these figures you can learn the different perspectives. The front, side and top views are clarified by means of the colors used.
You see the cavalry, dimetric, and isometric perspective.
Translated by
Image (3)Teacher, ICT co-ordinator, … -
Berlin Wall: Photos

Atmospheric images of the Berlin wall with neutral zone.
Translated by
ImageTeacher -
Blind getallenas to 100

An empty getallenas from zero to one hundred.
Translated by
Image (12)Student (teacher training)
Yummmm… cookies!
We don't like being tracked either. That's why we're concerned about your privacy.
Necessary cookies: for the proper operation of the website.
Functional cookies: for your convenience. recommended
Social media cookies: to view embedded media such as videos from YouTube, Facebook … recommended
Statistical cookies: for anonymous data collection to enhance user experience.